Unlocking Product Analytics for SaaS Growth
For B2B SaaS companies, the most important insights rarely come from the analytics of a website. They happen inside the product.
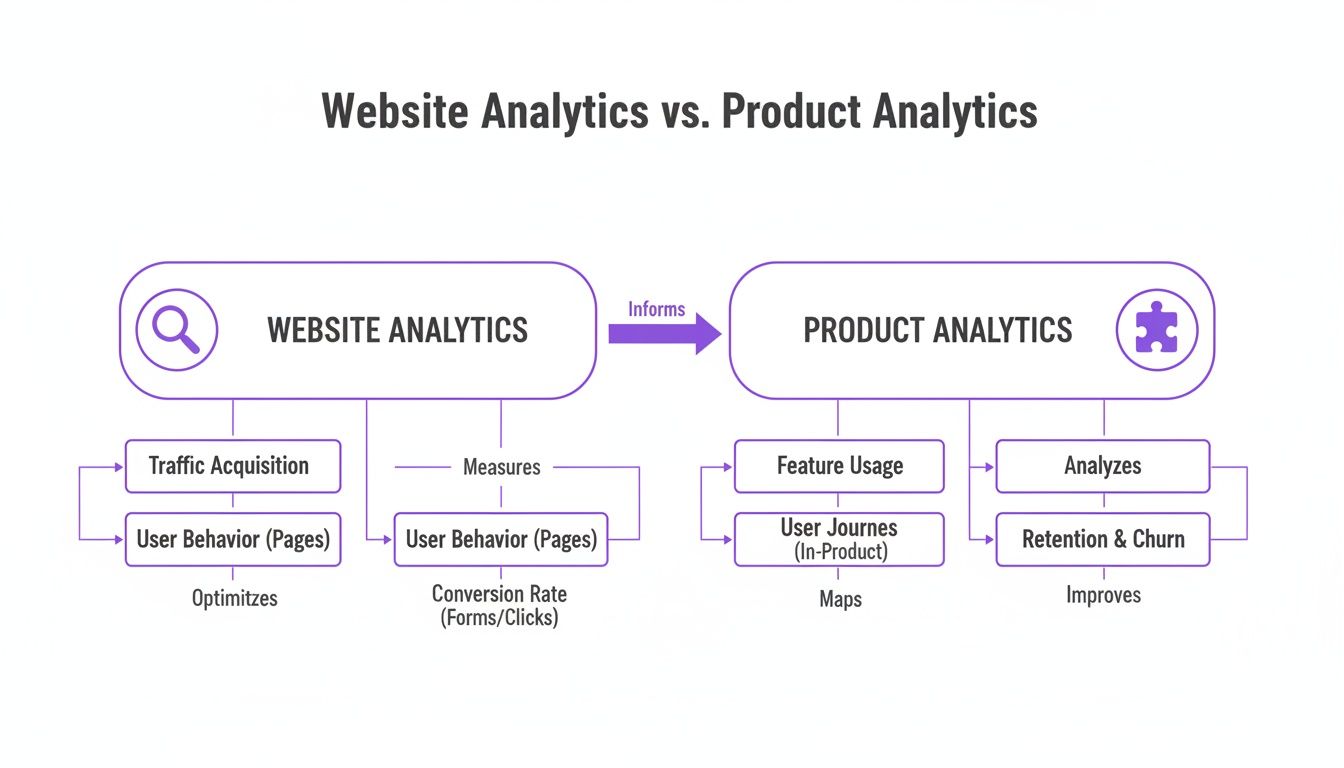
Traditional website analytics measure attention (traffic, clicks, page paths). Product analytics measures value creation (the actions that turn a free trial into a paid subscription).
What this guide will help you do
Define a clear activation moment, instrument clean events, use funnels to find onboarding friction, and translate product signals into higher trial-to-paid conversion.
Website Analytics vs Product Analytics (The Shift That Matters)
Stop obsessing over page views and bounce rates. Those metrics tell you who is knocking on your door. They reveal very little about what happens once a trial user steps inside your app.
The product-led question is not “Where did this user come from?” It’s:
- What did they do to reach value?
- Where did they get stuck?
- Which actions predict a paid upgrade?
| Metric Category | Product Metric (Actionable) | SaaS Scenario Example | Website Metric (Vanity) |
|---|---|---|---|
| New User Value | Activation Rate | A new user imports data and creates their first report within 24 hours. | Sign-ups |
| Ongoing Value | Core Action Engagement | 3+ users generate a report at least weekly. | DAU |
| Product Stickiness | Key Feature Adoption | 40% connect a critical integration (Slack / Salesforce). | Page Views |
| Revenue Potential | PQL Conversion Rate | Of accounts that invite a teammate, 25% upgrade to paid. | Bounce Rate |
Step 1: Identify Your “Aha!” Moment (Then Turn It Into a Metric)
Your “Aha!” moment is the first time a new user experiences the core promise of your product. It should be a measurable action, not a feeling.
Example (project management SaaS):
- Aha moment = user creates a project and invites a teammate
Now turn that into an activation definition:
Activation = A user creates a project AND invites at least one collaborator within 24 hours of signing up.
Once you define activation, the activation rate becomes straightforward:
Activation Rate = (Activated Users ÷ New Sign-ups) × 100
A low activation rate is rarely a marketing problem. It’s almost always onboarding friction.
- Good: You can tell if a user reached value within a time window.
- Bad: “User logged in twice” or “user visited settings.”
Step 2: Define the Core Product Metrics That Predict Revenue
SaaS teams usually track too many metrics. The goal isn’t measurement — it’s prediction.
Here are the product metrics that tend to map cleanly to trial conversion:
Activation
Activation is not a sign-up. It’s the first meaningful outcome.
What to measure: completion of your activation definition (the Aha action).
Time-to-Value (TTV)
TTV is the time from sign-up to the first meaningful outcome.
What to measure: how long it takes a new user to complete activation, plus where the time is spent.
Engagement (Core Actions)
Engagement isn’t “time in app.” It’s repeated use of the product’s most valuable behaviors.
What to measure: weekly active users performing a cluster of core actions. For more nuance, see engagement metrics (or the short engagement metrics definition).
Feature Adoption
Feature adoption tells you whether users are discovering and using the capabilities that make your product sticky.
What to measure: the percentage of active users that use a key feature within a defined time window. See feature adoption rate.
Product-Qualified Leads (PQLs)
A PQL is an account that shows intent — it has done the things that correlate with upgrading.
What to measure: conversion rate from PQL → paid, and time-to-PQL.
Practical rule
If a metric can’t trigger a decision (“Ship this”, “Change onboarding”, “Message this cohort”, “Reach out to this account”), it’s not a core metric.
Step 3: Instrument Your Product for Clean, Actionable Data
If you want reliable insights, you need structured tracking. Without good instrumentation, analytics becomes guesswork.
The first step is to create a tracking plan — a list of the exact events you will track and why.
Events + Properties (The Minimum Structure)
- Events: actions (e.g., created project, invited teammate, connected integration)
- Event properties: context of an action (e.g., template used, plan type, source)
- User properties: who the user/account is (e.g., role, company size, industry)
Use a Naming Convention That Scales
A simple framework that works well is Object_Action.
Example: Project_Created, Teammate_Invited, Integration_Connected
Example: Tracking “Project Created”
Event Name: Project_Created
Event Properties:
template_used(e.g., “Marketing Campaign”, “Software Sprint”, “None”)collaborators_invited(e.g., 0, 1, 3)project_source(e.g., “Onboarding Checklist”, “Dashboard Button”)
User Properties (known already):
job_role(e.g., “Project Manager”, “Developer”)company_size(e.g., “1-10”, “11-50”)plan_type(e.g., “Free Trial”, “Pro”)
Step 4: Use Funnels to Find Exactly Where Users Get Stuck
Funnels are your best diagnostic tool for trial conversion. They show the step-by-step path to activation — and where drop-off is happening.
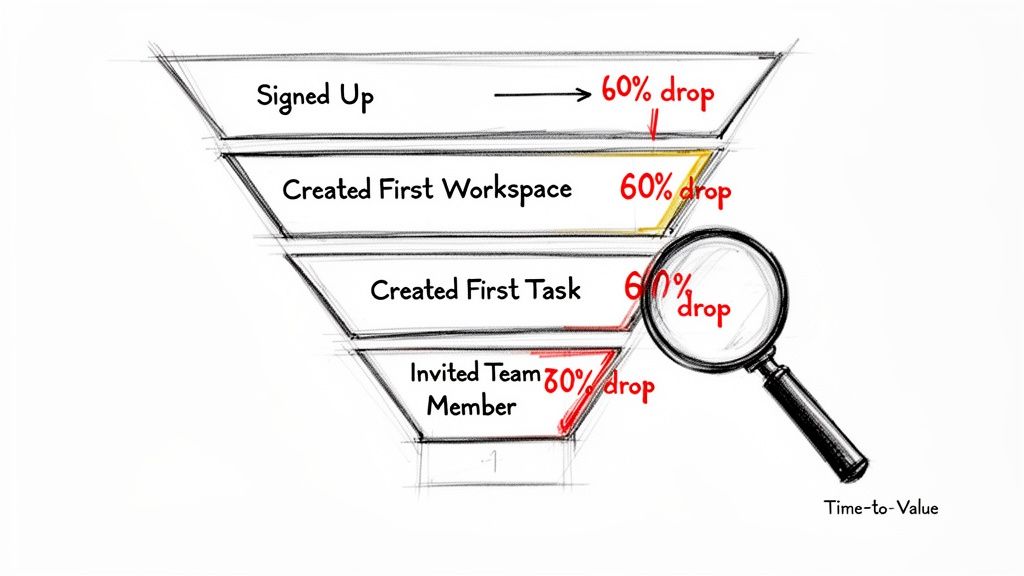
Example: A Trial-to-Activation Funnel
- Signed Up (100%)
- Created First Workspace (80%)
- Created First Task (30%)
- Invited Team Member (15%)
The biggest leak is between steps 2 and 3. That’s not a “growth” problem — it’s a product experience problem.
When you find a big drop-off, connect it to your KPI:
- A high drop-off increases TTV
- A higher TTV decreases activation
- Lower activation decreases trial-to-paid
Step 5: Translate Product Signals Into Conversion Strategy (PQLs + Interventions)
Raw data is noise. Funnels show where users get stuck. The next step is to use signals to drive proactive action — especially for accounts that are likely to convert.
Define a PQL Framework
A PQL definition should be specific and tied to your product’s core value.
Example PQL definition (B2B collaboration SaaS):
An account that meets all criteria in the first 7 days:
- 3+ active users
- 5+ shared documents created
- Slack integration used at least once
Build a PQL Dashboard
Track:
- New PQLs today/this week
- PQL → paid conversion rate
- Time-to-PQL
Watch Negative Signals Too
Negative signals indicate friction and churn risk.
Example: A user fails to connect an integration three times in an hour.
Intervention:
- Send an in-app message with a 2-minute guide
- If it’s a high-value account, auto-create a support ticket
A Practical Implementation Playbook (Week 1 Activation Lift)
We’ll focus on one KPI:
Goal: Increase Week 1 activation rate from 20% to 35%.
1) Define Activation Clearly
Activation: A new user invites at least one teammate within their first 7 days.
2) Instrument the Key Event
Track the invite action as a clean event, e.g. Teammate_Invited, with properties like invite_source and seat_count.
3) Build the Baseline Funnel
Two steps:
- Signed up
- Invited teammate
4) Identify the Drop-Off
You’ll often find the biggest leak is on the invite screen: users reach it, but never click “send.”
5) Implement a Targeted Intervention
Add a small, contextual message that explains why inviting teammates matters (shared workflows, faster outcomes, better collaboration).
6) Measure Weekly
Track conversion weekly and iterate based on the funnel, not opinions.
The EngageKit View: Turn Events Into Guidance (Not Just Reports)
Mixpanel and Amplitude are excellent for analysis. But most teams still struggle to turn insights into consistent action during the trial.
EngageKit is built to close that loop:
- Define the milestones that matter: activation, adoption, PQL signals.
- Detect stalls automatically: when users don’t progress, you don’t have to manually hunt the cohort.
- Trigger the next best step: in-app guidance and follow-ups tied to real product behavior.
If you want to stop losing trials to preventable friction, start with a single activation definition and a single funnel — then automate the response when users stall.
Subscribe to our newsletter
The latest news, articles, and resources, sent to your inbox weekly.